
Studio Rankings
Steam publishers ranked by our estimated lifetime gross across their catalog. Toggle to developers view or resort by portfolio size, hit rate, or median revenue. Estimates derived from review-based modelling, updated daily.
Tracked publishers 106,078
Total games 180,835
Total est. gross $101.8B
| # | Publisher | Games | Total gross ▼ | Median | $1M+ hits | Hit rate | Biggest hit |
|---|---|---|---|---|---|---|---|
| 1 | Electronic Arts | 165 | $5.7B | $1.8M | 87 | 52.7% |  |
| 2 | Ubisoft | 175 | $3.9B | $791.2K | 82 | 46.9% |  |
| 3 | BANDAI NAMCO Entertainment | 102 | $3.4B | $4.7M | 75 | 73.5% |  |
| 4 | Paradox Interactive | 83 | $3.3B | $965.1K | 41 | 49.4% |  |
| 5 | CAPCOM Co. | 129 | $3.2B | $779 | 45 | 34.9% |  |
| 6 | Rockstar Games | 20 | $3.2B | $16.1M | 17 | 85.0% |  |
| 7 | 2K | 99 | $3.1B | $2.6M | 65 | 65.7% |  |
| 8 | CD PROJEKT RED | 11 | $2.7B | $7.7M | 7 | 63.6% |  |
| 9 | Xbox Game Studios | 89 | $2.5B | $6.4M | 62 | 69.7% |  |
| 10 | FromSoftware | 8 | $2.4B | $160.4M | 8 | 100.0% | |
| 11 | Activision | 82 | $2.3B | $788.4K | 39 | 47.6% |  |
| 12 | PlayStation Publishing LLC | 29 | $2.2B | $26.4M | 22 | 75.9% |  |
| 13 | Game Science | 3 | $2.2B | $0 | 1 | 33.3% |  |
| 14 | Bethesda Softworks | 70 | $2.1B | $5.7M | 46 | 65.7% |  |
| 15 | SEGA | 153 | $2.1B | $2.8M | 100 | 65.4% |  |
| 16 | Aspyr (Mac) | 13 | $1.7B | $27.7M | 11 | 84.6% | |
| 17 | Larian Studios | 8 | $1.5B | $9.4M | 6 | 75.0% |  |
| 18 | Coffee Stain Publishing | 21 | $1.2B | $4.7M | 15 | 71.4% |  |
| 19 | Warner Bros. Games | 20 | $1.2B | $27.9M | 17 | 85.0% |  |
| 20 | Square Enix | 197 | $1.1B | $589.3K | 88 | 44.7% |  |
| 21 | Feral Interactive (Mac) | 30 | $1.1B | $15.8M | 28 | 93.3% | |
| 22 | Aspyr (Linux) | 7 | $1.0B | $40.3M | 5 | 71.4% | |
| 23 | Focus Entertainment | 77 | $980.5M | $1.0M | 39 | 50.6% |  |
| 24 | Deep Silver | 46 | $925.3M | $3.1M | 30 | 65.2% |  |
| 25 | Valve | 47 | $920.9M | $743.4K | 21 | 44.7% |  |
| 26 | Pearl Abyss | 2 | $906.7M | $453.4M | 2 | 100.0% | 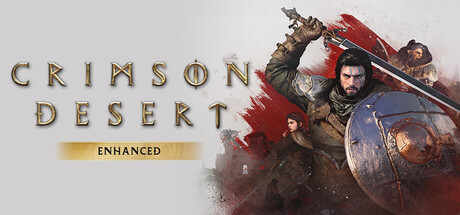 |
| 27 | Feral Interactive (Linux) | 16 | $899.5M | $42.9M | 14 | 87.5% | |
| 28 | Bohemia Interactive | 52 | $848.2M | $3.8K | 7 | 13.5% |  |
| 29 | BeamNG | 1 | $824.7M | $824.7M | 1 | 100.0% |  |
| 30 | Facepunch Studios | 5 | $793.0M | $586.8K | 2 | 40.0% |  |
| 31 | Devolver Digital | 169 | $706.5M | $578.3K | 71 | 42.0% | 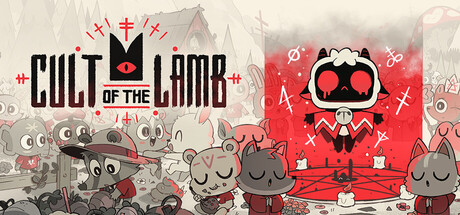 |
| 32 | Techland | 6 | $701.1M | $55.3M | 4 | 66.7% | 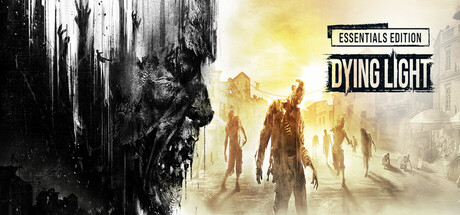 |
| 33 | THQ Nordic | 181 | $677.4M | $394.5K | 69 | 38.1% |  |
| 34 | KOEI TECMO GAMES CO. | 118 | $640.7M | $641.4K | 51 | 43.2% | 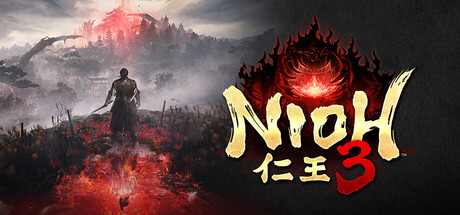 |
| 35 | Team Cherry | 3 | $628.8M | $101.8M | 2 | 66.7% |  |
| 36 | Warner Bros. Interactive Entertainment | 40 | $622.5M | $4.9M | 33 | 82.5% |  |
| 37 | Team17 | 81 | $589.3M | $1.2M | 45 | 55.6% |  |
| 38 | Snail Games USA | 18 | $589.2M | $203.6K | 6 | 33.3% |  |
| 39 | The Fun Pimps Entertainment LLC | 2 | $579.6M | $289.8M | 1 | 50.0% |  |
| 40 | Kinetic Games | 1 | $565.3M | $565.3M | 1 | 100.0% | 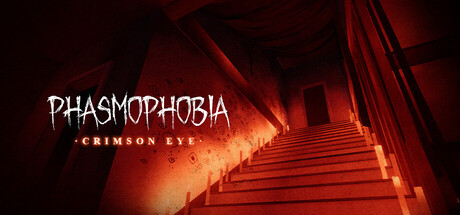 |
| 41 | VOID Interactive | 1 | $560.4M | $560.4M | 1 | 100.0% |  |
| 42 | Studio Wildcard | 4 | $530.1M | $121.7M | 3 | 75.0% | |
| 43 | TaleWorlds Entertainment | 4 | $516.5M | $45.9M | 4 | 100.0% |  |
| 44 | 505 Games | 68 | $512.0M | $594.7K | 29 | 42.6% |  |
| 45 | Hooded Horse | 49 | $479.2M | $3.0M | 27 | 55.1% |  |
| 46 | Unknown Worlds Entertainment | 7 | $475.6M | $2.4M | 4 | 57.1% | 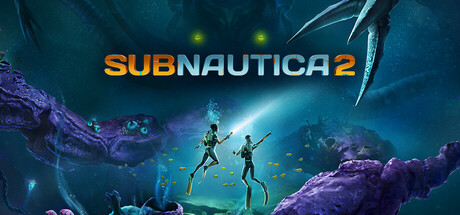 |
| 47 | PlayWay S.A. | 550 | $463.2M | $0 | 45 | 8.2% |  |
| 48 | Amazon Game Studios | 6 | $438.5M | $0 | 1 | 16.7% | 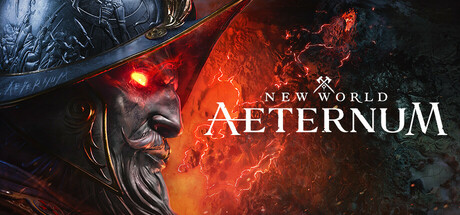 |
| 49 | Kepler Interactive | 20 | $432.8M | $2.0M | 11 | 55.0% | 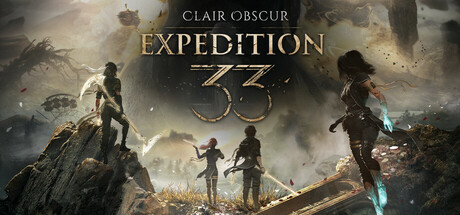 |
| 50 | ConcernedApe | 1 | $421.0M | $421.0M | 1 | 100.0% |  |