
Studio Rankings
Steam developers ranked by our estimated lifetime gross across their catalog. Toggle to publishers view or resort by portfolio size, hit rate, or median revenue. Estimates derived from review-based modelling, updated daily.
Tracked developers 122,866
Total games 181,417
Total est. gross $102.2B
| # | Developer | Games | Total gross ▼ | Median | $1M+ hits | Hit rate | Biggest hit |
|---|---|---|---|---|---|---|---|
| 1 | CAPCOM Co. | 134 | $3.2B | $701 | 47 | 35.1% | 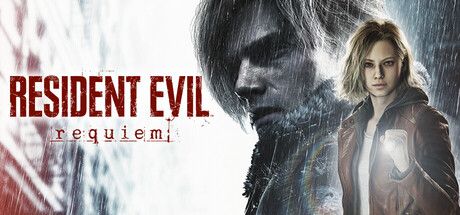 |
| 2 | CD PROJEKT RED | 9 | $2.6B | $7.7M | 5 | 55.6% | 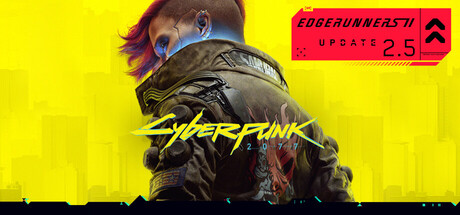 |
| 3 | Paradox Development Studio | 17 | $2.5B | $965.1K | 8 | 47.1% |  |
| 4 | FromSoftware | 10 | $2.4B | $134.5M | 8 | 80.0% | 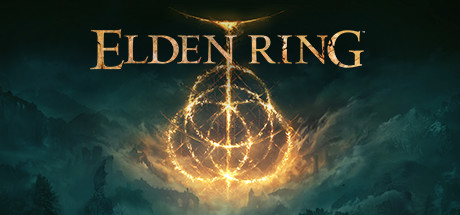 |
| 5 | Ubisoft Montreal | 37 | $2.2B | $4.2M | 24 | 64.9% |  |
| 6 | Game Science | 3 | $2.2B | $0 | 1 | 33.3% | 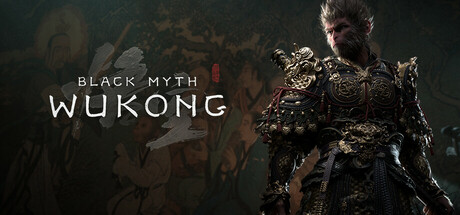 |
| 7 | Rockstar North | 4 | $2.1B | $172.7M | 4 | 100.0% |  |
| 8 | Treyarch | 13 | $1.8B | $42.1M | 12 | 92.3% |  |
| 9 | Aspyr (Mac) | 13 | $1.7B | $27.7M | 11 | 84.6% |  |
| 10 | Larian Studios | 8 | $1.5B | $9.4M | 6 | 75.0% |  |
| 11 | Ubisoft Shanghai | 7 | $1.3B | $93.4M | 7 | 100.0% | |
| 12 | Bethesda Game Studios | 14 | $1.3B | $25.2M | 12 | 85.7% |  |
| 13 | Infinity Ward | 15 | $1.2B | $29.4M | 15 | 100.0% | |
| 14 | Firaxis Games | 24 | $1.2B | $1.7M | 15 | 62.5% | |
| 15 | Raven Software | 22 | $1.2B | $5.9M | 15 | 68.2% | |
| 16 | Sledgehammer Games | 12 | $1.1B | $35.1M | 12 | 100.0% | |
| 17 | Feral Interactive (Mac) | 30 | $1.1B | $15.8M | 28 | 93.3% |  |
| 18 | Beenox | 10 | $1.1B | $30.4M | 10 | 100.0% | |
| 19 | DICE | 11 | $1.1B | $51.7M | 10 | 90.9% |  |
| 20 | High Moon Studios | 7 | $1.1B | $42.1M | 7 | 100.0% | |
| 21 | Aspyr (Linux) | 7 | $1.0B | $40.3M | 5 | 71.4% | |
| 22 | Rockstar Games | 10 | $1.0B | $18.9M | 7 | 70.0% |  |
| 23 | Ubisoft Kiev | 7 | $1.0B | $64.6M | 6 | 85.7% | |
| 24 | Ubisoft Montpellier | 15 | $991.1M | $11.8M | 11 | 73.3% |  |
| 25 | Hazelight Studios | 4 | $952.5M | $231.8M | 3 | 75.0% |  |
| 26 | Demonware | 5 | $928.9M | $42.1M | 5 | 100.0% | |
| 27 | Facepunch Studios | 6 | $919.8M | $2.2M | 3 | 50.0% |  |
| 28 | Ubisoft Toronto | 7 | $915.8M | $31.6M | 6 | 85.7% | |
| 29 | Pearl Abyss | 2 | $906.7M | $453.4M | 2 | 100.0% | 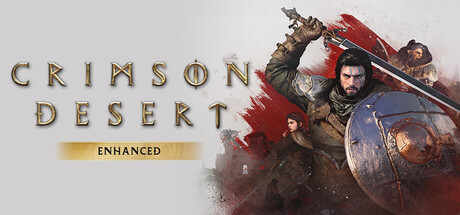 |
| 30 | Feral Interactive (Linux) | 16 | $899.5M | $42.9M | 14 | 87.5% | |
| 31 | Square Enix | 139 | $878.1M | $641.9K | 67 | 48.2% | 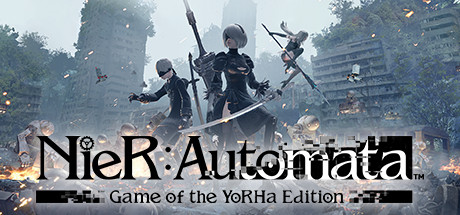 |
| 32 | Ubisoft Quebec | 5 | $876.4M | $209.3M | 5 | 100.0% | |
| 33 | CREATIVE ASSEMBLY | 25 | $846.1M | $9.2M | 18 | 72.0% | |
| 34 | Bohemia Interactive | 39 | $841.7M | $0 | 6 | 15.4% | 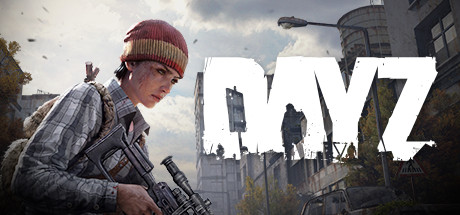 |
| 35 | Activision Shanghai | 4 | $839.5M | $30.4M | 4 | 100.0% | |
| 36 | BeamNG | 1 | $824.7M | $824.7M | 1 | 100.0% |  |
| 37 | Gearbox Software | 20 | $805.2M | $3.0M | 16 | 80.0% | 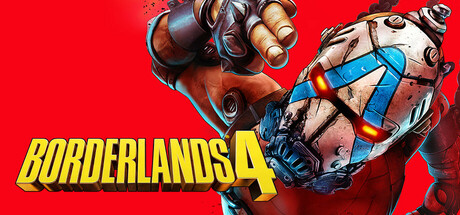 |
| 38 | Valve | 50 | $789.3M | $0 | 18 | 36.0% | 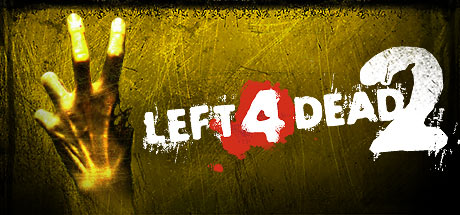 |
| 39 | EA Canada | 6 | $772.3M | $130.2M | 6 | 100.0% |  |
| 40 | Nixxes Software | 9 | $756.0M | $68.9M | 9 | 100.0% |  |
| 41 | Techland | 12 | $743.4M | $4.0M | 7 | 58.3% | 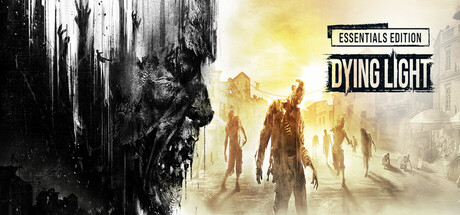 |
| 42 | EA Romania | 5 | $728.6M | $151.7M | 5 | 100.0% | |
| 43 | Red Storm | 2 | $716.6M | $358.3M | 2 | 100.0% | |
| 44 | KOEI TECMO GAMES CO. | 126 | $682.9M | $658.9K | 57 | 45.2% | 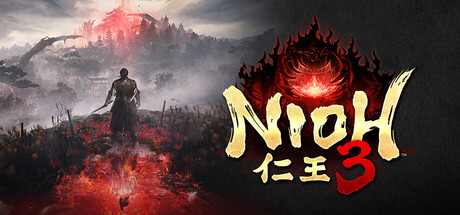 |
| 45 | Arrowhead Game Studios | 4 | $681.6M | $10.3M | 4 | 100.0% |  |
| 46 | Saber Interactive | 33 | $643.5M | $34.4K | 15 | 45.5% |  |
| 47 | Ubisoft Belgrade | 4 | $638.6M | $165.5M | 4 | 100.0% | |
| 48 | Team Cherry | 3 | $628.8M | $101.8M | 2 | 66.7% | 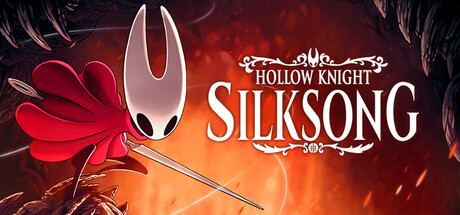 |
| 49 | Ubisoft Singapore | 4 | $604.8M | $159.2M | 4 | 100.0% | |
| 50 | QLOC | 14 | $601.8M | $17.5M | 11 | 78.6% |  |