
Studio Rankings
Steam developers ranked by our estimated lifetime gross across their catalog. Toggle to publishers view or resort by portfolio size, hit rate, or median revenue. Estimates derived from review-based modelling, updated daily.
Tracked developers 122,866
Total games 181,417
Total est. gross $102.2B
| # | Developer | Games | Total gross ▼ | Median | $1M+ hits | Hit rate | Biggest hit |
|---|---|---|---|---|---|---|---|
| 101 | Iron Galaxy Studios | 12 | $329.2M | $5.2M | 8 | 66.7% |  |
| 102 | Colossal Order | 4 | $326.4M | $58.2M | 3 | 75.0% |  |
| 103 | Psyonix LLC | 1 | $325.0M | $325.0M | 1 | 100.0% |  |
| 104 | Moon Studios GmbH | 4 | $312.5M | $72.2M | 4 | 100.0% |  |
| 105 | Sandfall Interactive | 2 | $303.8M | $151.9M | 1 | 50.0% |  |
| 106 | Quantic Dream | 7 | $301.7M | $5.8M | 4 | 57.1% |  |
| 107 | Visual Concepts | 11 | $301.7M | $15.4M | 8 | 72.7% |  |
| 108 | SCS Software | 20 | $301.2M | $31.0K | 3 | 15.0% |  |
| 109 | Nixxes | 3 | $298.5M | $107.2M | 3 | 100.0% |  |
| 110 | Behaviour Interactive Inc. | 8 | $295.7M | $258.7K | 2 | 25.0% |  |
| 111 | Ghost Ship Games | 2 | $292.8M | $146.4M | 2 | 100.0% | 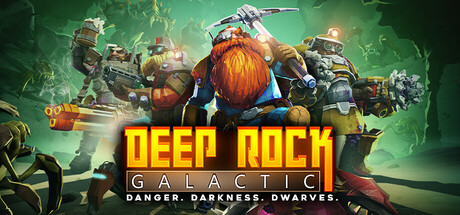 |
| 112 | TVGS | 1 | $292.3M | $292.3M | 1 | 100.0% |  |
| 113 | Jetpack Interactive | 2 | $290.9M | $145.5M | 2 | 100.0% | 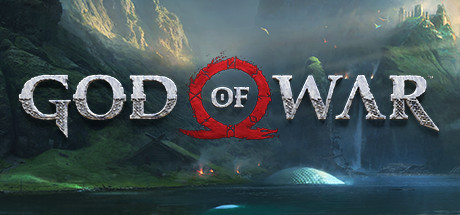 |
| 114 | Santa Monica Studio | 2 | $290.9M | $145.5M | 2 | 100.0% | |
| 115 | Klei Entertainment | 16 | $290.1M | $1.9M | 11 | 68.8% | 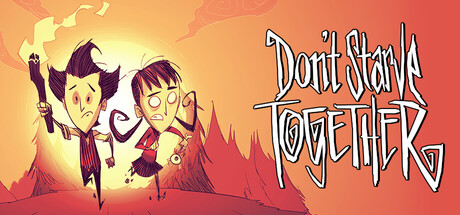 |
| 116 | Hello Games | 5 | $287.2M | $202.9K | 2 | 40.0% |  |
| 117 | Grove Street Games | 7 | $287.0M | $72 | 1 | 14.3% | 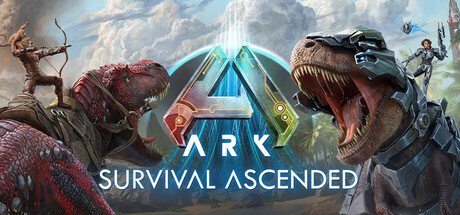 |
| 118 | Ubisoft Romania | 5 | $283.5M | $344.4K | 1 | 20.0% | 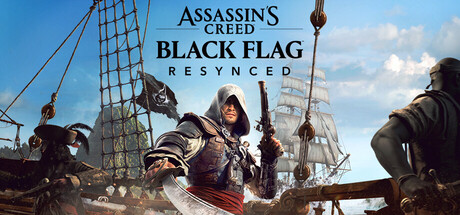 |
| 119 | Ubisoft Barcelona | 1 | $282.5M | $282.5M | 1 | 100.0% | |
| 120 | Ubisoft India | 1 | $282.5M | $282.5M | 1 | 100.0% | |
| 121 | Re-Logic | 1 | $281.3M | $281.3M | 1 | 100.0% | 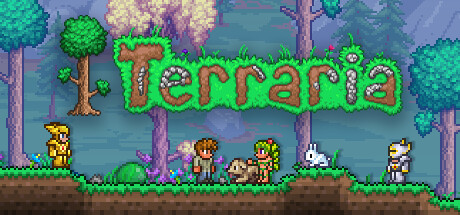 |
| 122 | ZA/UM | 2 | $277.8M | $138.9M | 2 | 100.0% | 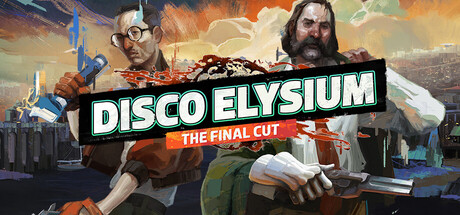 |
| 123 | 4A Games | 5 | $273.2M | $41.0M | 4 | 80.0% | 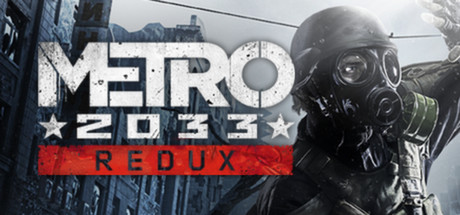 |
| 124 | Naughty Dog LLC | 3 | $271.1M | $69.6M | 3 | 100.0% | |
| 125 | Reflections | 4 | $265.7M | $995.5K | 2 | 50.0% |  |
| 126 | Rebellion | 25 | $264.8M | $1.2M | 14 | 56.0% |  |
| 127 | Ubisoft Milan | 1 | $263.2M | $263.2M | 1 | 100.0% | |
| 128 | Asobo Studio | 10 | $261.6M | $6.0M | 6 | 60.0% |  |
| 129 | Tantalus Media | 3 | $260.7M | $42.6M | 3 | 100.0% |  |
| 130 | GSC Game World | 16 | $255.3M | $1.4M | 8 | 50.0% | 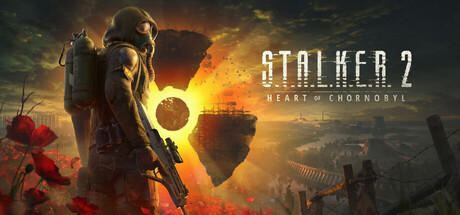 |
| 131 | Virtual Basement LLC | 4 | $250.5M | $3.7M | 4 | 100.0% | 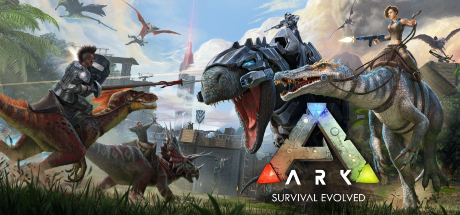 |
| 132 | Shiver | 1 | $246.4M | $246.4M | 1 | 100.0% | 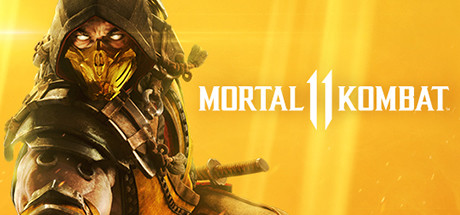 |
| 133 | Efecto Studios | 5 | $243.4M | $0 | 2 | 40.0% | |
| 134 | 11 bit studios | 11 | $242.8M | $481.2K | 5 | 45.5% | 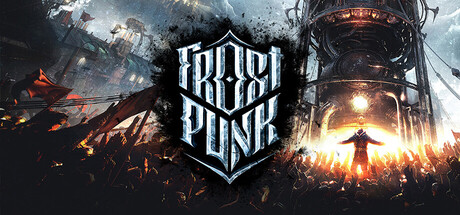 |
| 135 | BioWare | 14 | $240.8M | $6.7M | 9 | 64.3% |  |
| 136 | Embark Studios | 2 | $240.3M | $120.2M | 1 | 50.0% |  |
| 137 | Fatshark | 9 | $237.4M | $661.4K | 3 | 33.3% |  |
| 138 | Crytek | 16 | $236.5M | $153.0K | 7 | 43.8% | 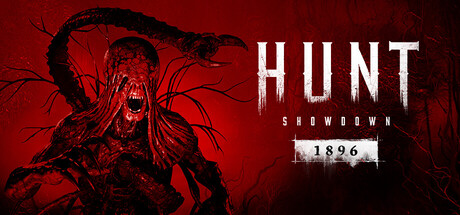 |
| 139 | Hopoo Games | 4 | $228.8M | $7.0M | 4 | 100.0% |  |
| 140 | Blue Byte | 5 | $223.8M | $5.6M | 3 | 60.0% |  |
| 141 | Hangar 13 | 5 | $223.5M | $43.6M | 5 | 100.0% | 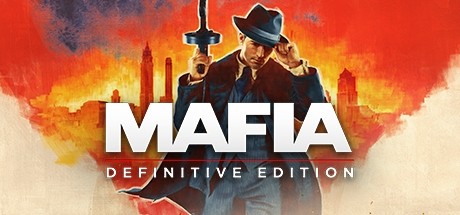 |
| 142 | CaptureAge | 2 | $218.1M | $109.0M | 2 | 100.0% | |
| 143 | Funcom | 11 | $217.2M | $0 | 3 | 27.3% |  |
| 144 | Blizzard Entertainment | 3 | $216.8M | $9.1M | 2 | 66.7% | 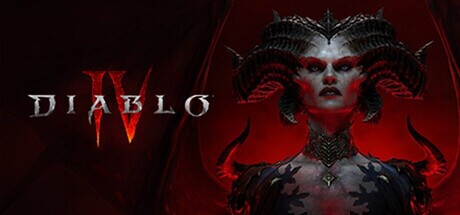 |
| 145 | Offworld | 3 | $213.9M | $66.2M | 3 | 100.0% |  |
| 146 | Arsi "Hakita" Patala | 1 | $213.7M | $213.7M | 1 | 100.0% | 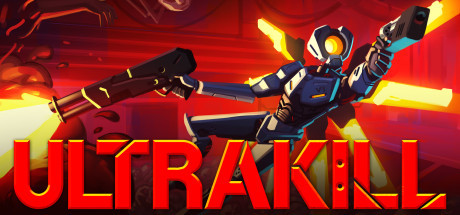 |
| 147 | Kiev | 2 | $206.8M | $103.4M | 2 | 100.0% | 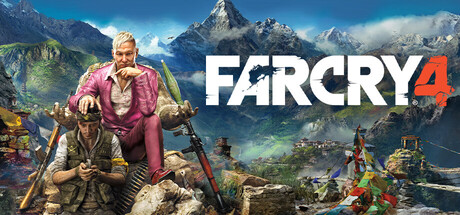 |
| 148 | Shanghai | 2 | $206.8M | $103.4M | 2 | 100.0% | |
| 149 | Splash Damage | 13 | $205.3M | $0 | 3 | 23.1% | 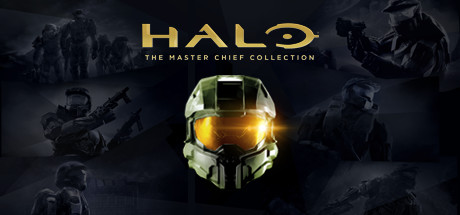 |
| 150 | tobyfox | 2 | $205.2M | $102.6M | 2 | 100.0% | 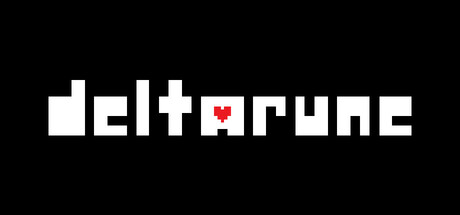 |