
Studio Rankings
Steam developers ranked by our estimated lifetime gross across their catalog. Toggle to publishers view or resort by portfolio size, hit rate, or median revenue. Estimates derived from review-based modelling, updated daily.
Tracked developers 122,866
Total games 181,417
Total est. gross $102.2B
| # | Developer | Games | Total gross ▼ | Median | $1M+ hits | Hit rate | Biggest hit |
|---|---|---|---|---|---|---|---|
| 51 | Battlefield Studios | 1 | $583.8M | $583.8M | 1 | 100.0% | 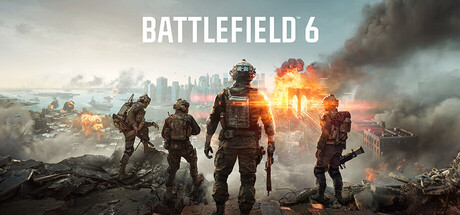 |
| 52 | The Fun Pimps | 1 | $579.4M | $579.4M | 1 | 100.0% | 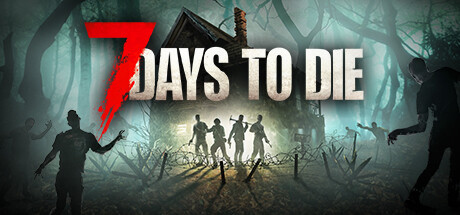 |
| 53 | Kinetic Games | 1 | $565.3M | $565.3M | 1 | 100.0% | 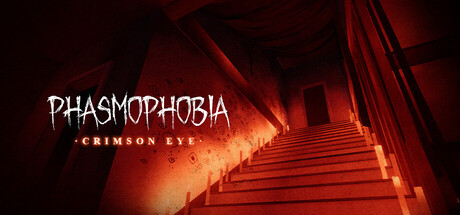 |
| 54 | VOID Interactive | 2 | $560.4M | $280.2M | 1 | 50.0% | 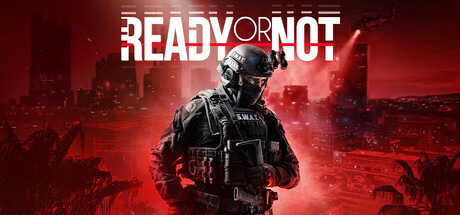 |
| 55 | Endnight Games Ltd | 2 | $557.1M | $278.6M | 2 | 100.0% |  |
| 56 | Instinct Games | 4 | $548.7M | $129.7M | 4 | 100.0% |  |
| 57 | Playground Games | 3 | $532.5M | $158.2M | 2 | 66.7% |  |
| 58 | Studio Wildcard | 4 | $530.1M | $121.7M | 3 | 75.0% | |
| 59 | Paradox Tinto | 2 | $526.1M | $263.1M | 2 | 100.0% |  |
| 60 | TaleWorlds Entertainment | 4 | $516.5M | $45.9M | 4 | 100.0% |  |
| 61 | Ubisoft Bucharest | 3 | $513.8M | $250.6M | 2 | 66.7% |  |
| 62 | ATLUS | 23 | $511.4M | $2.5M | 14 | 60.9% |  |
| 63 | Avalanche Software | 9 | $501.5M | $546.7K | 3 | 33.3% | 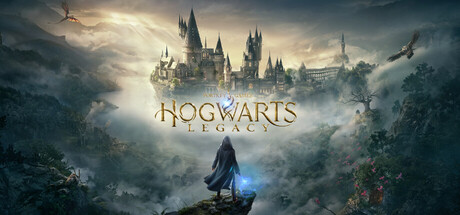 |
| 64 | Ubisoft | 36 | $485.3M | $63.8K | 10 | 27.8% |  |
| 65 | Iron Gate AB | 1 | $485.3M | $485.3M | 1 | 100.0% | 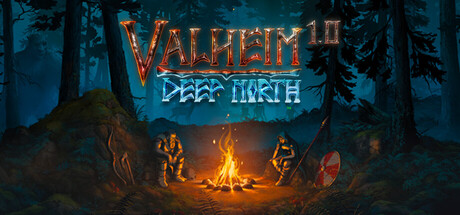 |
| 66 | Feral Interactive | 5 | $480.2M | $58.6M | 5 | 100.0% | 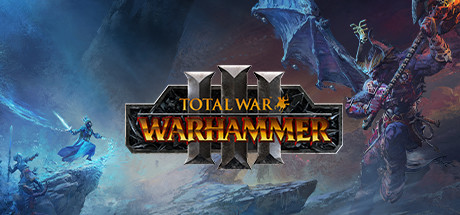 |
| 67 | Unknown Worlds Entertainment | 7 | $477.0M | $2.4M | 5 | 71.4% | 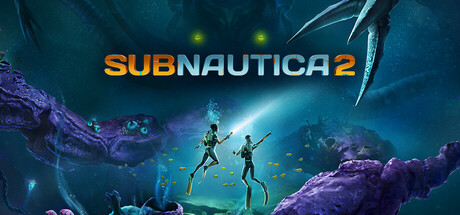 |
| 68 | Forgotten Empires | 7 | $467.0M | $49.4M | 7 | 100.0% | 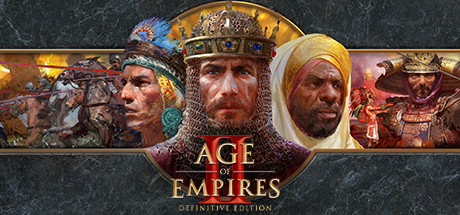 |
| 69 | Hazelight Studio | 1 | $449.4M | $449.4M | 1 | 100.0% |  |
| 70 | Amazon Game Studios | 1 | $438.2M | $438.2M | 1 | 100.0% | 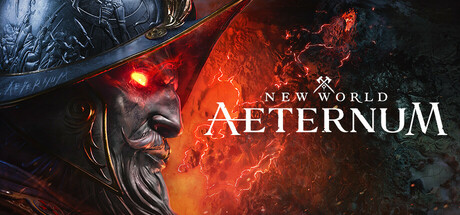 |
| 71 | ConcernedApe | 1 | $421.0M | $421.0M | 1 | 100.0% |  |
| 72 | Warhorse Studios | 6 | $410.0M | $12.2K | 2 | 33.3% | 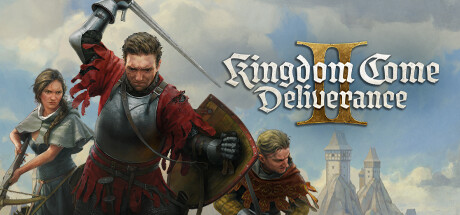 |
| 73 | Frontier Developments | 17 | $408.5M | $8.5M | 13 | 76.5% | 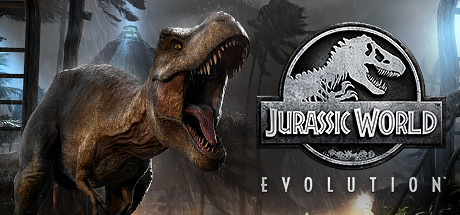 |
| 74 | Eidos-Montréal | 6 | $397.1M | $72.0M | 6 | 100.0% | 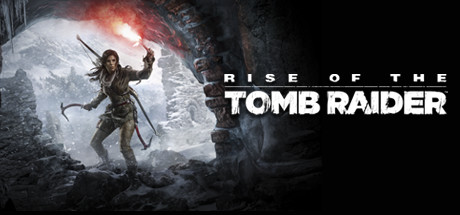 |
| 75 | BANDAI NAMCO Studios Inc. | 20 | $395.7M | $4.8M | 10 | 50.0% | 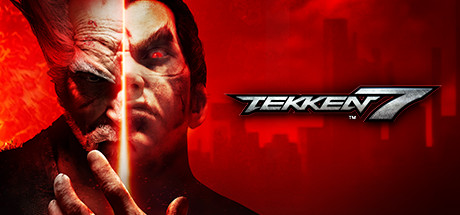 |
| 76 | Pocketpair | 6 | $382.4M | $755.9K | 3 | 50.0% | 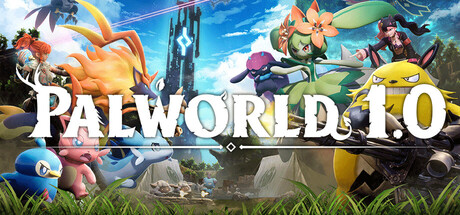 |
| 77 | Insomniac Games | 7 | $378.3M | $26.4M | 5 | 71.4% | 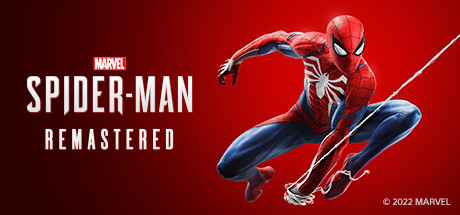 |
| 78 | NetherRealm Studios | 26 | $374.7M | $0 | 5 | 19.2% | 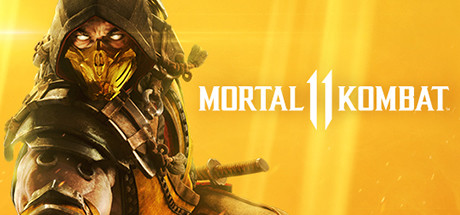 |
| 79 | Red Barrels | 3 | $367.7M | $71.0M | 3 | 100.0% |  |
| 80 | Ubisoft Kyiv | 3 | $365.9M | $58.3M | 3 | 100.0% | 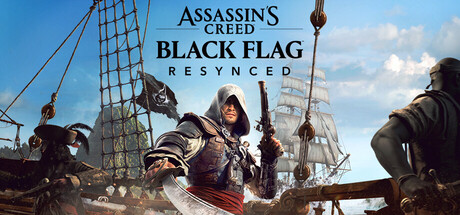 |
| 81 | Respawn Entertainment | 4 | $365.8M | $79.0M | 3 | 75.0% | 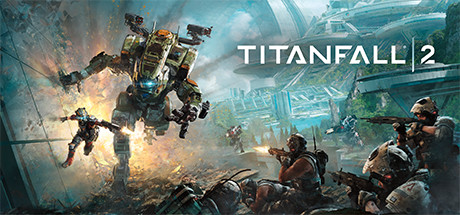 |
| 82 | Ubisoft Bordeaux | 4 | $364.3M | $40.9M | 3 | 75.0% | |
| 83 | Obsidian Entertainment | 19 | $363.2M | $10.2M | 14 | 73.7% |  |
| 84 | World's Edge | 6 | $358.1M | $32.1M | 5 | 83.3% | |
| 85 | id Software | 23 | $356.8M | $4.0M | 14 | 60.9% | 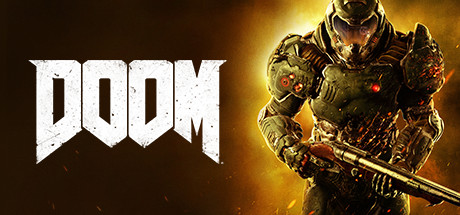 |
| 86 | Relic Entertainment | 27 | $353.4M | $879.5K | 13 | 48.1% |  |
| 87 | The Indie Stone | 1 | $353.0M | $353.0M | 1 | 100.0% | 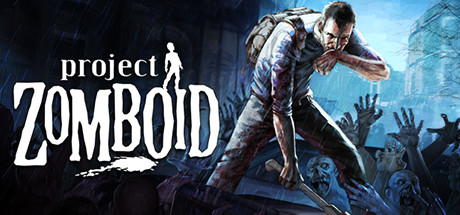 |
| 88 | Ubisoft Annecy | 3 | $352.9M | $64.6M | 3 | 100.0% | |
| 89 | Ubisoft Chengdu | 3 | $352.1M | $67.8M | 3 | 100.0% | |
| 90 | Coffee Stain Studios | 6 | $351.7M | $2.9M | 5 | 83.3% |  |
| 91 | Ubisoft Philippines | 2 | $350.3M | $175.1M | 2 | 100.0% | |
| 92 | Massive Entertainment | 6 | $349.4M | $40.0K | 2 | 33.3% |  |
| 93 | Mega Crit | 2 | $347.8M | $173.9M | 2 | 100.0% | 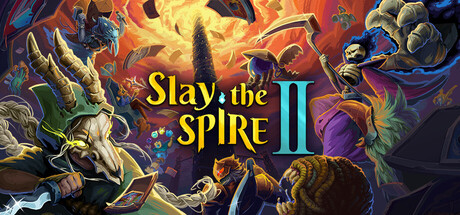 |
| 94 | Ubisoft Paris | 4 | $344.7M | $40.8M | 3 | 75.0% | |
| 95 | Stunlock Studios | 5 | $342.6M | $0 | 1 | 20.0% | 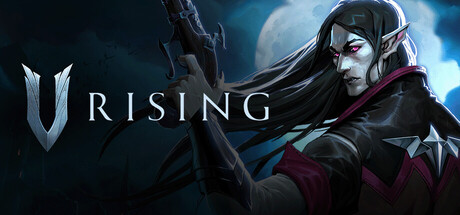 |
| 96 | Mediatonic | 7 | $340.7M | $243.6K | 2 | 28.6% |  |
| 97 | Supergiant Games | 6 | $338.8M | $7.2M | 5 | 83.3% | 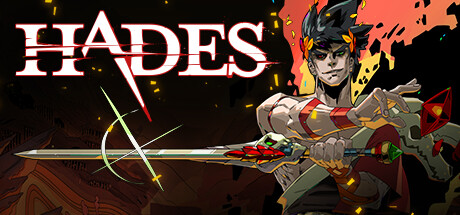 |
| 98 | Crystal Dynamics | 18 | $331.8M | $1.7M | 10 | 55.6% | |
| 99 | Arc System Works | 53 | $331.3M | $111.1K | 17 | 32.1% | 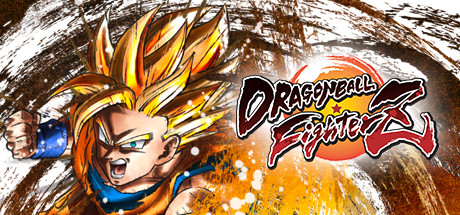 |
| 100 | Rare Ltd | 2 | $329.2M | $164.6M | 1 | 50.0% | 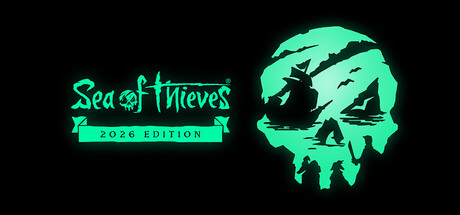 |