
Cyberpunk theme
Every paid Steam game tagged Cyberpunk, ranked by our estimated lifetime revenue. 4,239 games in the catalog, 2,286 with a sales estimate.
Games
4,239
Active paid titles tagged
Total Gross
$3.0B
Sum of estimated lifetime revenue
Median
$2.0K
Half earn less, half more
Hit Rate
18.3%
418 games earned $100K+
Revenue share - top 5 vs rest
- Cyberpunk 2077 44.2%
- Detroit: Become Human 8.6%
- Stray 4.3%
- Atomic Heart 3.0%
- METAL GEAR RISING: REVENGEANCE 2.2%
- Other (2281 games) 37.7%
Top 25 earners
The highest-earning Cyberpunk games by our estimator.
| # | Game | Released | Reviews | Peak CCU | Est. Units | Est. Gross |
|---|---|---|---|---|---|---|
| 1 |  Cyberpunk 2077 CD PROJEKT RED | 2020-12-09 | 1,001,587 | 830,387 | 22,034,914 | $1,321,874,491 |
| 2 |  Detroit: Become Human Quantic Dream | 2020-06-18 | 269,249 | 25,615 | 6,461,976 | $258,414,420 |
| 3 |  Stray BlueTwelve Studio | 2022-07-19 | 180,077 | 51,455 | 4,321,848 | $129,612,222 |
| 4 |  Atomic Heart Mundfish | 2023-02-20 | 59,496 | 37,222 | 1,487,400 | $89,169,630 |
| 5 |  METAL GEAR RISING: REVENGEANCE PlatinumGames | 2014-01-09 | 89,436 | 11,964 | 2,146,464 | $64,372,455 |
| 6 |  Ghostrunner One More Level, 3D Realms, Slipgate Ironworks™, All in! Games | 2020-10-27 | 67,144 | 5,033 | 1,611,456 | $48,327,565 |
| 7 |  Marathon Bungie | 2026-03-05 | 65,045 | 87,656 | 910,630 | $36,416,094 |
| 8 |  RoboCop: Rogue City Teyon | 2023-11-02 | 38,249 | 4,953 | 841,478 | $33,650,705 |
| 9 |  Deus Ex: Mankind Divided Eidos Montreal, Feral Interactive (Linux/Mac) | 2016-08-23 | 42,447 | 52,051 | 1,096,785 | $32,892,582 |
| 10 |  Katana ZERO Askiisoft | 2019-04-18 | 76,554 | 1,520 | 2,122,289 | $31,813,112 |
| 11 |  Watch Dogs: Legion Ubisoft Toronto | 2023-01-26 | 12,778 | 2,872 | 526,153 | $31,563,918 |
| 12 | 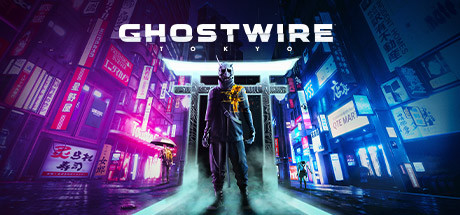 Ghostwire: Tokyo Tango Gameworks | 2022-03-24 | 21,373 | 14,082 | 470,206 | $28,207,658 |
| 13 |  Hi-Fi RUSH Tango Gameworks | 2023-01-25 | 36,143 | 5,438 | 867,432 | $26,014,286 |
| 14 |  NINJA GAIDEN 4 PlatinumGames Inc. / Team NINJA / KOEI TECMO GAMES CO., LTD. | 2025-10-20 | 10,049 | 11,196 | 335,880 | $23,508,241 |
| 15 |  Cruelty Squad Consumer Softproducts | 2021-06-15 | 25,283 | 1,736 | 1,053,981 | $21,069,080 |
| 16 |  Dead as Disco Brain Jar Games, Inc. | 2026-05-05 | 15,354 | 8,343 | 827,638 | $20,682,674 |
| 17 |  Bomb Rush Cyberfunk Team Reptile | 2023-08-18 | 15,816 | 6,915 | 511,963 | $20,473,400 |
| 18 |  Killing Floor 3 Tripwire Interactive | 2025-07-24 | 24,133 | 10,583 | 464,499 | $18,575,315 |
| 19 |  BlazBlue Entropy Effect 91Act | 2024-02-14 | 37,097 | 11,842 | 890,328 | $17,797,657 |
| 20 |  Mirror's Edge™ DICE | 2009-01-14 | 39,541 | 278 | 869,902 | $17,389,341 |
| 21 |  SIGNALIS rose-engine | 2022-10-27 | 35,469 | 691 | 851,256 | $17,016,607 |
| 22 |  The Ascent Neon Giant | 2021-07-29 | 25,478 | 13,930 | 560,516 | $16,809,875 |
| 23 |  SANABI WONDER POTION | 2023-11-08 | 45,593 | 7,648 | 1,094,232 | $16,402,538 |
| 24 |  RAGE 2 id Software, Avalanche Studios | 2019-05-13 | 17,102 | 13,591 | 407,730 | $16,305,123 |
| 25 |  Digimon Story Cyber Sleuth: Complete Edition h.a.n.d., Inc., Media.Vision Inc. | 2019-10-17 | 13,434 | 3,408 | 300,703 | $15,005,080 |
Releases per year
Is Cyberpunk trending up or fading? Bars show new paid Steam releases with this tag each year. Green flecks are hits (≥$100K est. lifetime).
5
2010
6
2011
5
2012
18
2013
24
2014
41
2015
51
2016
69
2017
66
2018
86
2019
155
2020
232
2021
246
2022
286
2023
354
2024
411
2025
573
2026
Top upcoming
Highest-wishlist unreleased Cyberpunk games.
| # | Game | WL Rank |
|---|---|---|
| 1 |  NO LAW Neon Giant | 42 |
| 2 |  Den of Wolves 10 Chambers | 78 |
| 3 |  SPINE - This is Gun Fu Nekki | 89 |
| 4 |  ExeKiller Paradark Studio | 119 |
| 5 |  DEFECT emptyvessel | 171 |
| 6 |  N1RV Ann-A: Cyberpunk Bartender Action Sukeban Games | 206 |
| 7 |  The Last Night Odd Tales | 207 |
| 8 |  Kaiju Cleanup Brightrock Games | 224 |
| 9 |  Supreme Experiment Argunov games | 234 |
| 10 |  SacriFire Pixelated Milk | 244 |
Top recent (12 months)
Highest-earning Cyberpunk games released in the past year.
| # | Game | Est. Gross |
|---|---|---|
| 1 | | $36,416,094 |
| 2 | | $20,682,674 |
| 3 |  | $14,768,271 |
| 4 | 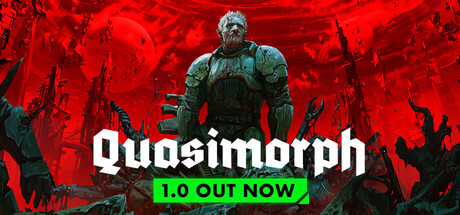 | $11,903,762 |
| 5 |  | $4,624,726 |
| 6 |  | $3,420,588 |
| 7 |  | $2,922,533 |
| 8 |  | $2,142,288 |
| 9 |  | $1,068,665 |
| 10 |  | $1,050,186 |