
Racing gameplay
Every paid Steam game tagged Racing, ranked by our estimated lifetime revenue. 5,543 games in the catalog, 3,711 with a sales estimate.
Games
5,543
Active paid titles tagged
Total Gross
$5.9B
Sum of estimated lifetime revenue
Median
$1.4K
Half earn less, half more
Hit Rate
15.3%
569 games earned $100K+
Revenue share - top 5 vs rest
- Grand Theft Auto V Legacy 29.5%
- BeamNG.drive 13.9%
- Forza Horizon 5 6.3%
- Rocket League® 5.5%
- Grand Theft Auto V Enhanced 3.9%
- Other (3706 games) 40.9%
Top 25 earners
The highest-earning Racing games by our estimator.
| # | Game | Released | Reviews | Peak CCU | Est. Units | Est. Gross |
|---|---|---|---|---|---|---|
| 1 | 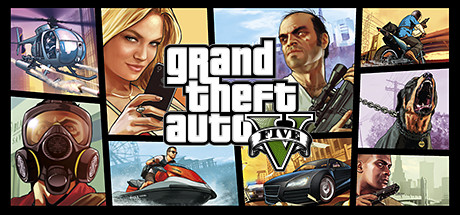 Grand Theft Auto V Legacy Rockstar North | 2015-04-13 | 2,083,712 | 360,761 | 29,171,968 | $1,750,026,360 |
| 2 |  BeamNG.drive BeamNG | 2015-05-29 | 428,778 | 47,248 | 33,119,404 | $827,653,906 |
| 3 |  Forza Horizon 5 Playground Games | 2021-11-08 | 284,043 | 80,745 | 6,248,946 | $374,874,271 |
| 4 |  Rocket League® Psyonix LLC | 2015-07-06 | 580,496 | 146,902 | 8,126,944 | $324,996,491 |
| 5 |  Grand Theft Auto V Enhanced Rockstar North | 2025-03-04 | 236,899 | 161,456 | 7,826,752 | $234,646,025 |
| 6 |  Forza Horizon 6 Playground Games | 2026-05-18 | 103,739 | 299,404 | 2,282,258 | $159,735,237 |
| 7 |  Need for Speed™ Heat Ghost Games | 2020-06-04 | 155,328 | 85,230 | 2,174,592 | $152,199,694 |
| 8 |  The Crew™ 2 Ivory Tower | 2018-06-28 | 99,819 | 55,125 | 3,583,125 | $107,457,919 |
| 9 |  Mafia: Definitive Edition Hangar 13 | 2020-09-24 | 112,375 | 13,589 | 2,472,250 | $98,865,278 |
| 10 |  Need for Speed™ Unbound Criterion Games | 2022-12-01 | 61,080 | 14,053 | 1,343,760 | $94,049,762 |
| 11 |  Steep™ Ubisoft Annecy, Ubisoft Montpellier, Ubisoft Kiev | 2016-12-02 | 34,668 | 3,014 | 2,144,125 | $64,302,309 |
| 12 |  City Car Driving Forward Development, Ltd. | 2016-11-03 | 36,550 | 2,375 | 2,077,011 | $51,904,505 |
| 13 |  Assetto Corsa Kunos Simulazioni | 2014-12-19 | 175,812 | 20,175 | 2,484,300 | $49,661,157 |
| 14 |  Assetto Corsa Competizione Kunos Simulazioni | 2019-05-29 | 49,091 | 12,290 | 1,178,184 | $47,115,578 |
| 15 | 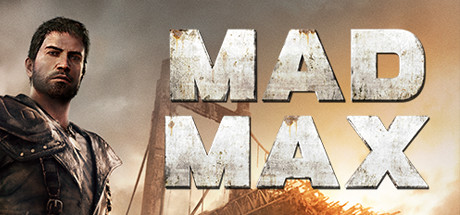 Mad Max Avalanche Studios | 2015-09-01 | 91,192 | 33,356 | 2,188,608 | $43,750,274 |
| 16 | 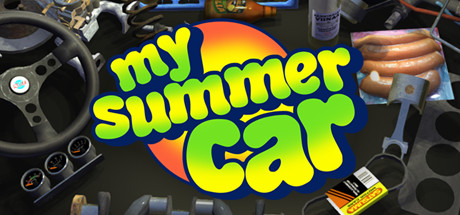 My Summer Car Amistech Games | 2025-01-08 | 118,962 | 7,875 | 2,855,088 | $42,797,769 |
| 17 |  SnowRunner Saber Interactive | 2021-05-17 | 57,519 | 12,007 | 1,380,456 | $41,379,169 |
| 18 |  The Crew Motorfest Ubisoft Ivory Tower | 2024-04-18 | 26,564 | 12,813 | 584,408 | $40,902,716 |
| 19 |  Sleeping Dogs: Definitive Edition United Front Games, Feral Interactive (Mac) | 2014-10-08 | 80,648 | 4,000 | 1,935,552 | $38,691,684 |
| 20 |  MudRunner Saber Interactive | 2017-10-30 | 44,756 | 6,922 | 1,898,739 | $37,879,843 |
| 21 |  DiRT Rally 2.0 Codemasters | 2019-02-25 | 48,741 | 5,074 | 1,862,559 | $37,232,554 |
| 22 |  Car Mechanic Simulator 2018 Red Dot Games | 2017-07-28 | 57,049 | 23,989 | 1,857,409 | $36,941,801 |
| 23 |  F1® 25 Codemasters | 2025-05-30 | 31,454 | 22,595 | 691,988 | $34,589,514 |
| 24 |  Trailmakers Flashbulb | 2019-09-18 | 40,327 | 8,040 | 1,283,132 | $32,065,469 |
| 25 |  F1® 24 Codemasters | 2024-05-31 | 19,169 | 13,327 | 421,718 | $29,516,043 |
Releases per year
Is Racing trending up or fading? Bars show new paid Steam releases with this tag each year. Green flecks are hits (≥$100K est. lifetime).
9
2010
19
2011
12
2012
18
2013
60
2014
87
2015
140
2016
207
2017
255
2018
256
2019
264
2020
327
2021
339
2022
453
2023
566
2024
617
2025
607
2026
Top upcoming
Highest-wishlist unreleased Racing games.
| # | Game | WL Rank |
|---|---|---|
| 1 |  Car Mechanic Simulator 2027 Red Dot Games | 54 |
| 2 |  Left! Left! LEFT! Stellux Interactive | 201 |
| 3 | 249 | |
| 4 |  Car For Sale Together Red Core Interactive | 264 |
| 5 |  Into the Wind Bloom & Gloom Games | 292 |
| 6 |  CLUTCH Maverick Games | 330 |
| 7 |  Airframe Ultra Videocult, Akupara Games | 473 |
| 8 |  Half Grip Half Games | 510 |
| 9 |  Taxi Simulator Asmodev | 516 |
| 10 |  Motorsport Manager 2 Playsport Games | 547 |

Top recent (12 months)
Highest-earning Racing games released in the past year.
| # | Game | Est. Gross |
|---|---|---|
| 1 | | $159,735,237 |
| 2 | 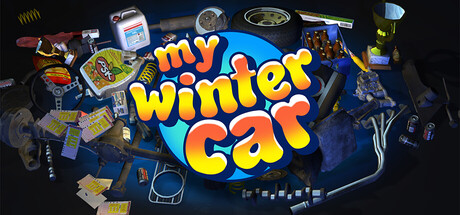 | $25,615,197 |
| 3 |  | $13,621,449 |
| 4 |  | $8,846,060 |
| 5 | 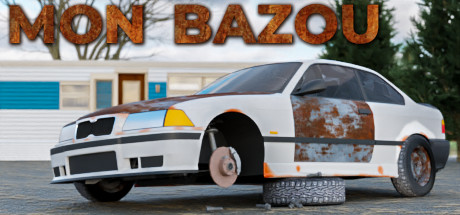 | $8,593,026 |
| 6 |  | $4,831,958 |
| 7 |  | $3,801,290 |
| 8 |  | $3,243,937 |
| 9 |  | $2,922,533 |
| 10 |  | $2,914,834 |