
Hack and Slash gameplay
Every paid Steam game tagged Hack and Slash, ranked by our estimated lifetime revenue. 6,544 games in the catalog, 3,555 with a sales estimate.
Games
6,544
Active paid titles tagged
Total Gross
$10.2B
Sum of estimated lifetime revenue
Median
$3.2K
Half earn less, half more
Hit Rate
25.6%
909 games earned $100K+
Revenue share - top 5 vs rest
- Black Myth: Wukong 21.3%
- Dying Light 6.7%
- Phantom Blade Zero 2.8%
- Sekiro™: Shadows Die Twice - GOTY Edition 2.5%
- God of War 2.2%
- Other (3550 games) 64.4%
Top 25 earners
The highest-earning Hack and Slash games by our estimator.
| # | Game | Released | Reviews | Peak CCU | Est. Units | Est. Gross |
|---|---|---|---|---|---|---|
| 1 |  Black Myth: Wukong Game Science | 2024-08-19 | 1,215,212 | 2,406,967 | 36,104,505 | $2,165,909,255 |
| 2 |  Dying Light Techland | 2015-01-26 | 498,873 | 45,770 | 27,438,015 | $685,675,995 |
| 3 |  Phantom Blade Zero S-GAME Studio | 2026-10-28 | 107,543 | 825,984 | 4,817,926 | $289,027,381 |
| 4 |  Sekiro™: Shadows Die Twice - GOTY Edition FromSoftware, Inc. | 2019-03-21 | 359,223 | 124,334 | 4,310,676 | $258,597,453 |
| 5 |  God of War Santa Monica Studio, Jetpack Interactive | 2022-01-14 | 186,712 | 73,529 | 4,481,088 | $224,009,589 |
| 6 | 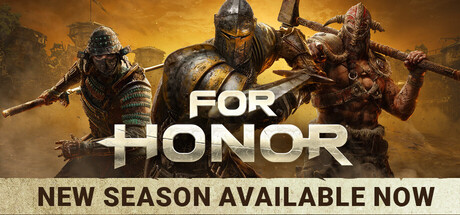 FOR HONOR™ Ubisoft Montreal, Ubisoft Quebec, Ubisoft Toronto, Blue Byte | 2017-02-13 | 166,349 | 216,499 | 6,986,658 | $209,529,873 |
| 7 | 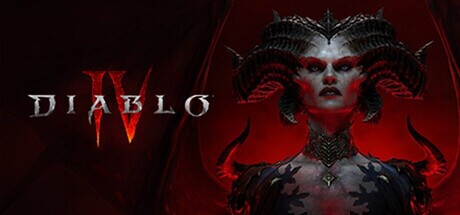 Diablo® IV Blizzard Entertainment, Inc. | 2023-10-17 | 80,588 | 63,906 | 4,153,890 | $207,652,961 |
| 8 | 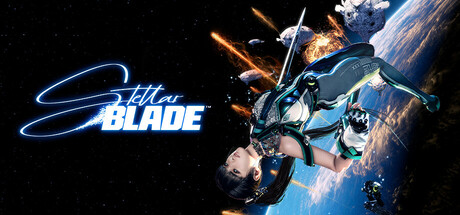 Stellar Blade™ SHIFT UP Corporation | 2025-06-11 | 96,371 | 130,770 | 3,372,985 | $202,345,370 |
| 9 | 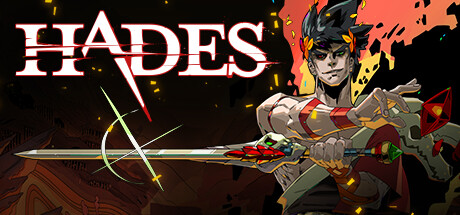 Hades Supergiant Games | 2020-09-17 | 310,618 | 54,015 | 7,454,832 | $186,296,252 |
| 10 | 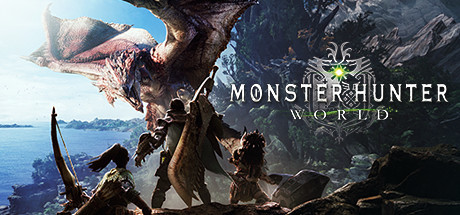 Monster Hunter: World CAPCOM Co., Ltd. | 2018-08-08 | 520,449 | 329,333 | 5,724,939 | $171,527,980 |
| 11 | 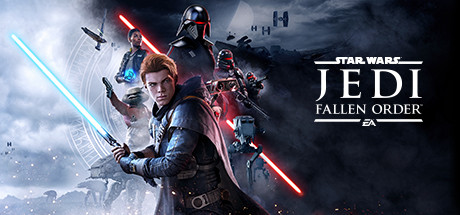 STAR WARS Jedi: Fallen Order™ Respawn Entertainment | 2019-11-14 | 176,235 | 46,513 | 3,877,170 | $155,048,028 |
| 12 | 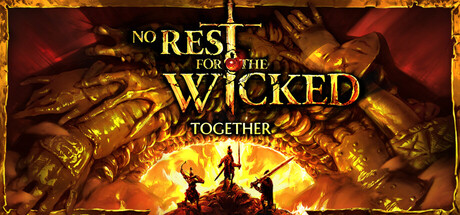 No Rest for the Wicked Moon Studios GmbH | 2024-04-18 | 83,224 | 62,805 | 3,495,408 | $139,781,366 |
| 13 |  Path of Exile 2 Grinding Gear Games | 2024-12-06 | 227,821 | 578,562 | 4,628,496 | $138,808,595 |
| 14 | 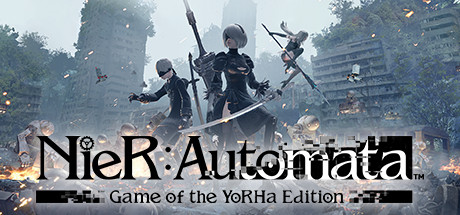 NieR:Automata™ Square Enix, PlatinumGames Inc. | 2017-03-17 | 154,584 | 23,813 | 3,400,848 | $135,999,912 |
| 15 | 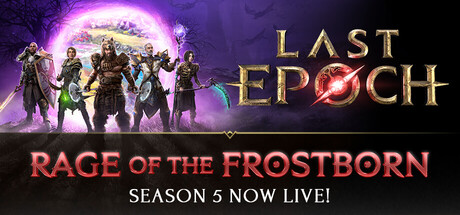 Last Epoch Eleventh Hour Games | 2024-02-21 | 119,309 | 258,503 | 3,877,545 | $135,675,300 |
| 16 | 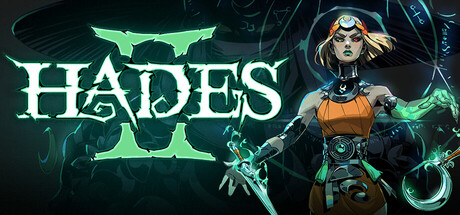 Hades II Supergiant Games | 2025-09-25 | 124,735 | 112,602 | 4,454,821 | $133,600,082 |
| 17 |  Middle-earth™: Shadow of War™ Monolith Productions | 2017-10-09 | 117,890 | 67,943 | 2,593,580 | $129,653,064 |
| 18 |  WUCHANG: Fallen Feathers Leenzee | 2025-07-23 | 107,232 | 40,805 | 2,359,104 | $117,931,609 |
| 19 | 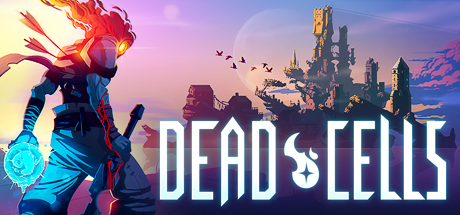 Dead Cells Motion Twin | 2018-08-06 | 184,897 | 14,880 | 4,437,528 | $110,849,449 |
| 20 |  Warhammer: Vermintide 2 Fatshark | 2018-03-08 | 148,103 | 104,134 | 3,258,266 | $97,715,397 |
| 21 |  Nioh 3 KOEI TECMO GAMES CO., LTD. | 2026-02-05 | 19,825 | 87,541 | 1,313,115 | $91,904,919 |
| 22 |  Killing Floor 2 Tripwire Interactive | 2016-11-18 | 129,653 | 69,246 | 2,919,088 | $87,543,449 |
| 23 |  Mount & Blade: Warband TaleWorlds Entertainment | 2010-03-31 | 172,634 | 32,799 | 4,223,667 | $84,431,103 |
| 24 |  CODE VEIN Bandai Namco Studios | 2019-09-26 | 62,879 | 22,946 | 1,383,338 | $82,986,447 |
| 25 |  Devil May Cry 5 CAPCOM Co., Ltd. | 2019-03-07 | 172,311 | 88,735 | 2,756,976 | $82,681,710 |
Releases per year
Is Hack and Slash trending up or fading? Bars show new paid Steam releases with this tag each year. Green flecks are hits (≥$100K est. lifetime).
14
2010
11
2011
23
2012
22
2013
47
2014
56
2015
64
2016
96
2017
106
2018
123
2019
213
2020
332
2021
394
2022
441
2023
601
2024
720
2025
785
2026
Top upcoming
Highest-wishlist unreleased Hack and Slash games.
| # | Game | WL Rank |
|---|---|---|
| 1 |  Tides of Annihilation Eclipse Glow Games | 20 |
| 2 |  State of Decay 3 Undead Labs | 23 |
| 3 | 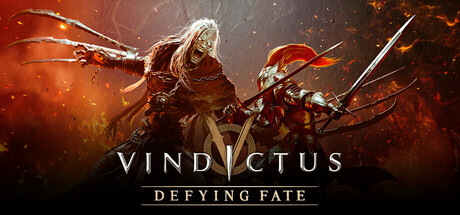 Vindictus: Defying Fate NEXON | 25 |
| 4 |  Crowsworn Mongoose Rodeo | 87 |
| 5 |  SPINE - This is Gun Fu Nekki | 89 |
| 6 | 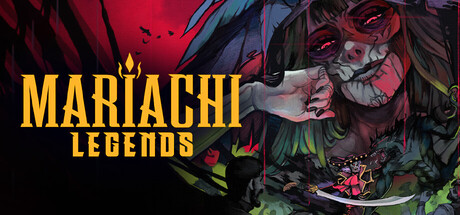 Mariachi Legends Halberd Studios | 106 |
| 7 |  V.A Proxy PyroLith | 122 |
| 8 | 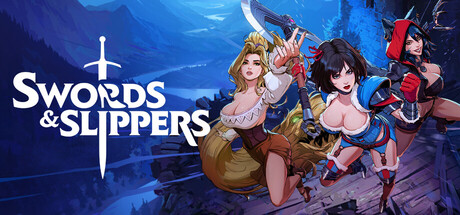 Swords & Slippers Mass Creation | 132 |
| 9 |  Darksiders 4 Gunfire Games | 137 |
| 10 |  GUNDAM ROGUE ORBIT Bandai Namco Studios Inc. | 140 |
Top recent (12 months)
Highest-earning Hack and Slash games released in the past year.
| # | Game | Est. Gross |
|---|---|---|
| 1 | | $289,027,381 |
| 2 | | $91,904,919 |
| 3 | 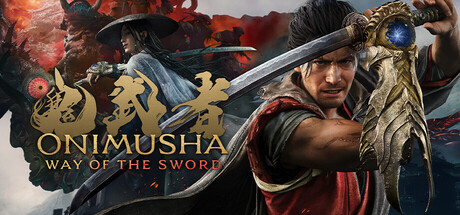 | $47,477,856 |
| 4 |  | $23,680,104 |
| 5 |  | $20,736,637 |
| 6 |  | $20,682,674 |
| 7 |  | $20,065,455 |
| 8 |  | $15,803,539 |
| 9 |  | $15,699,468 |
| 10 |  | $14,584,137 |